Which foods are the best protein? Ranked four ways
On this page
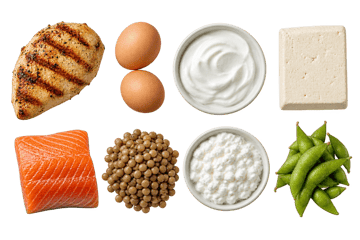
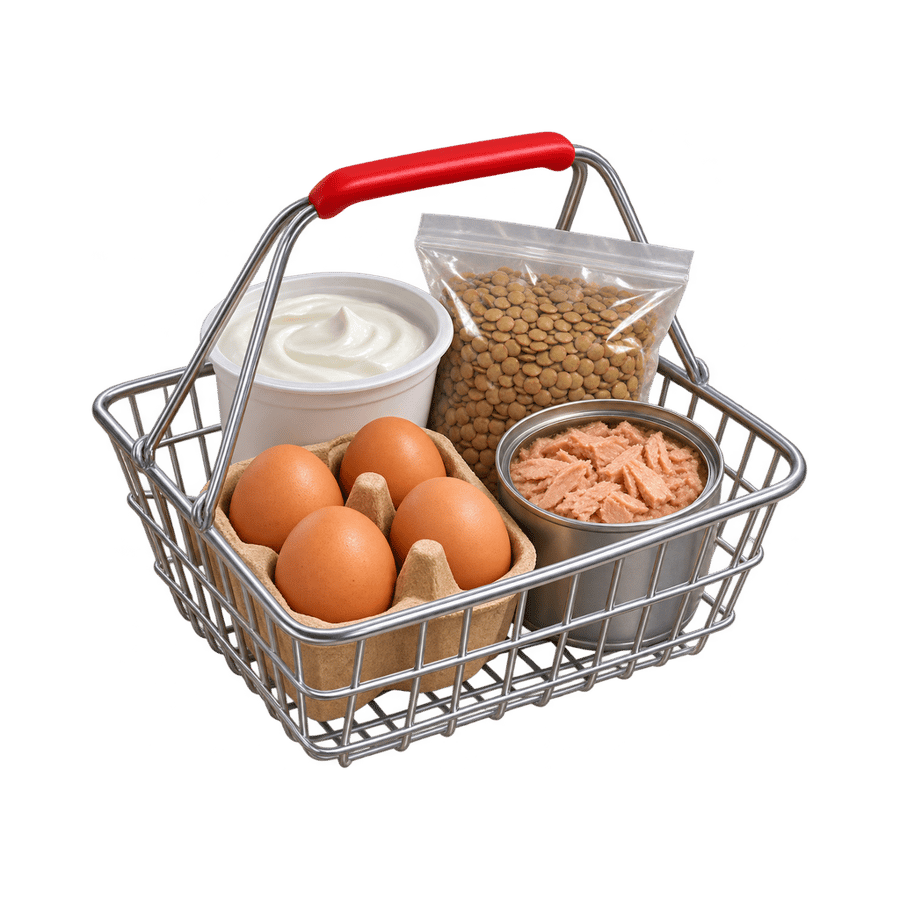
The best protein food depends on what you’re short of. If it’s calories, shrimp, canned tuna, cod, turkey and egg whites give you the most protein for the least. If it’s money, dried beans and eggs beat everything else at the store. If it’s quality, eggs, dairy, meat, fish and soy carry every essential amino acid in the amounts adults need. Eggs come closest to winning all three.
What we’d do
Keep two or three foods from the top of each list in your kitchen: a lean one for the meals that come up short (Greek yogurt, cottage cheese, tuna, chicken), a cheap one for the budget (eggs, dried beans), and, if you eat mostly plants, a soy food for quality. Then use the meal line calculator to see which meals need them. Your total for the day comes first, so start with your daily range. The Gyroscope app personalizes yours.
If you remember three things
- Per calorie, seafood and poultry win. Shrimp has 24.2 g of protein per 100 calories, peanut butter 3.7.
- Per dollar, dried beans win. A dollar buys about 58 g of protein from dried beans and 25 g from chicken breast.
- On quality, eggs, dairy, meat and soy lead. Grains and nuts run short on lysine.
Why every “top protein foods” list disagrees
Search for the best protein foods and you’ll get lists that put jerky or pumpkin seeds at the top. They’re usually ranked per 100 g, which rewards dry, dense foods. Beef jerky has 33 g of protein per 100 g, more than chicken breast, but it also has 410 calories in those 100 g. Ranked per serving, a big serving wins. Ranked per calorie, the lean foods win.
Each of these answers a different question, so here are four rankings, each from the same USDA rows, and you can pick the one that fits your problem.
1. Protein per 100 calories
This is the ranking for anyone trying to hit protein without eating a lot more, which is most people losing weight and most people on a GLP-1.
-
 Shrimp20.4 g in 3 oz 24.2 g
-
 Tuna, light, canned in water16.5 g in 3 oz drained 22.6 g
-
 Whey protein powder25 g in 1 scoop 22.2 g
-
 Cod19.4 g in 3 oz 21.7 g
-
 Turkey breast25.1 g in 3 oz 21.7 g
-
 Egg white3.6 g in 1 large white 21.0 g
-
 Chicken breast25.9 g in 3 oz cooked 20.2 g
- Pork tenderloin22.3 g in 3 oz 18.3 g
-
 Greek yogurt, plain nonfat15.3 g in 5.3 oz cup 17.3 g
-
 Cottage cheese, 1%14 g in 1/2 cup 17.2 g
- Seitan strips15 g in 2 oz 16.7 g
-
 Top sirloin, lean25 g in 3 oz 16.5 g
-
 Ground beef 93/724.6 g in 3 oz 13.8 g
-
 Tofu, firm21.8 g in 1/2 cup 12.0 g
-
 Salmon, farmed18.8 g in 3 oz 10.7 g
-
 Tempeh17.3 g in 3 oz 10.6 g
-
 Edamame, shelled18.4 g in 1 cup 9.8 g
- Egg, whole, large6.3 g in 1 large egg 8.8 g
-
 Lentils17.9 g in 1 cup 7.8 g
-
 Black beans15.2 g in 1 cup 6.7 g
-
 Milk, 2%8.1 g in 1 cup 6.6 g
-
 Cheddar6.5 g in 1 oz 5.7 g
-
 Pumpkin seeds8.6 g in 1 oz 5.4 g
-
 Chickpeas14.5 g in 1 cup 5.4 g
-
 Whole wheat bread4 g in 1 slice 4.9 g
-
 Bagel, plain11.1 g in 1 medium 4.0 g
-
 Peanut butter7.1 g in 2 tbsp 3.7 g
-
 Spaghetti7.2 g in 1 cup 3.7 g
-
 Quinoa8.1 g in 1 cup 3.7 g
-
 Almonds6 g in 1 oz 3.7 g
-
 Oats, dry5.3 g in 1/2 cup 3.5 g
-
 White rice4.3 g in 1 cup 2.1 g
Seafood and poultry take the top, with whey, egg whites and the strained dairy foods close behind. Seitan is the plant food highest on the list. The surprises are at the bottom. Peanut butter, almonds, quinoa and pasta all have 3.7 g of protein per 100 calories, less than a plain bagel (4.0) or a slice of whole wheat bread (4.9). They’re fine foods, but they aren’t protein foods. Every food is in the sortable table on the per-calorie calculator, and our lean protein or just more food page shows the same list as the calories it takes to reach 30 g.
2. Protein per dollar
The Bureau of Labor Statistics tracks US average prices for a handful of protein foods every month. Here’s what a dollar buys at October 2026 prices.
- Dried beans$1.68 per lb 58 g per $1
- Eggs$2.32 per dozen, grade A large 33 g per $1
- Whole milk$4.10 per gallon 30 g per $1
- Chicken breast$4.10 per lb, boneless 25 g per $1
- Cheddar$6.13 per lb 17 g per $1
Dried beans give you more than twice the protein per dollar of chicken breast, and a dozen eggs gives you more than chicken too. Ground beef and peanut butter aren’t on the list. BLS’s ground beef price doesn’t say how lean the beef is, so we can’t match it to a protein figure, and the peanut butter series stopped in 2017. The cost calculator turns these into your whole day.
3. Completeness: does it carry every essential amino acid?
Your body can’t make nine of the amino acids in protein, so they have to come from food. This ranking scores each food by its scarcest one, as a share of what adults need per gram of protein, from USDA’s amino acid data.
- Cottage cheese, 1%meets the pattern
100% - Egg whitemeets the pattern
100% - Greek yogurt, nonfatmeets the pattern
100% - Milkmeets the pattern
100% - Egg, wholemeets the pattern
100% - Pork tenderloinmeets the pattern
100% - Chicken breastmeets the pattern
100% - Salmonmeets the pattern
100% - Codmeets the pattern
100% -
 Sardinesmeets the pattern
100% - Chia seedsmeets the pattern
100% - Canned light tunameets the pattern
100% - Wheymeets the pattern
100% - Shrimpmeets the pattern
100% - Black beansmeets the pattern
100% - Soy (tofu, tempeh, edamame)meets the pattern
100% - Hummusmeets the pattern
100% - Top sirloinmeets the pattern
100% - Chickpeasmeets the pattern
100% - Oatsmeets the pattern
100% - Quinoameets the pattern
100% - Lentilsshort on methionine and cysteine
98% - Pumpkin seedsshort on lysine
91% - Hemp seedsshort on lysine
90% - Brown riceshort on lysine
80% - White riceshort on lysine
80% - Peanutsshort on lysine
77% - Peanut buttershort on lysine
68% - Whole wheatshort on lysine
60% - Almondsshort on lysine
60% - Pastashort on lysine
50%
Every animal food scores 100, and so do soy, black beans, chickpeas, quinoa and oats. Grains and nuts fall behind, all short on lysine: rice at 80, peanut butter at 68, whole wheat at 60 and pasta at 50. Our complete protein page charts all nine amino acids for each food, and plant combos shows which pairs fill the gap.
4. Digestibility: how much you absorb
Completeness counts what’s in the food. DIAAS, the score FAO recommended in 2013, also counts how much of each amino acid you absorb. The best published table pools pig studies of protein ingredients, from Laure Herreman and colleagues in 2020.
- Casein (milk)nothing under 100
117 - Porknothing under 100
117 - Eggnothing under 100
101 - Potatonothing under 100
100 - Soylimited by methionine and cysteine
91 - Wheylimited by histidine
85 - Pealimited by methionine and cysteine
70 - Oatlimited by lysine
57 - Hemplimited by lysine
54 - Wheatlimited by lysine
48 - Ricelimited by lysine
47 - Cornlimited by lysine
36
It’s scored against the pattern for young children, which is stricter than the adult one, so an adult would score higher on every row. The order is what’s useful: casein, pork, egg and potato at the top, then soy and whey, then pea, and grains last.
The all-rounders
Few foods rank well on every list. These come closest.
| Food | Protein per 100 calories | Cost per 25 g of protein | Amino acids | DIAAS |
|---|---|---|---|---|
| Eggs | 8.8 g | 77 cents | Meets the pattern | 101 (egg) |
| Dried black beans | 6.7 g (cooked) | 43 cents | Meets the pattern | Not measured |
| Chicken breast | 20.2 g | $1.00 | Meets the pattern | Not measured |
| Milk | 6.6 g | 83 cents | Meets the pattern | 117 (casein, milk’s main protein) |
| Firm tofu | 12.0 g | Not tracked | Meets the pattern (soy) | 91 (soy) |
| Nonfat Greek yogurt | 17.3 g | Not tracked | Meets the pattern | Not measured |
| Canned light tuna | 22.6 g | Not tracked | Meets the pattern | Not measured |
Eggs are the closest thing to a best protein food: cheap, complete, highly digestible and in the middle on calories. Chicken and tuna win on calories. Beans win on price and bring fiber, and a cup of them costs about 230 calories for 15 g of protein, which is why they work best next to a leaner food. Prices are BLS US averages for October 2026, and “not tracked” means BLS doesn’t publish a price for it.
How these rankings are worked out
Protein and calories are USDA FoodData Central’s SR Legacy records, one per food, the same rows every tool on this site uses. Grams per 100 calories is protein divided by calories times 100. Cost is the BLS price divided by the protein in that unit. The amino acid score is each food’s lowest essential amino acid per gram of protein, divided by the adult pattern from FAO’s 2013 report, capped at 100. DIAAS values are published numbers, never worked out here. Where USDA’s own records disagree, like the two canned tuna and firm tofu rows, the per-calorie calculator names the one used.
5 sources
- USDA FoodData Central, SR Legacy records for every food ranked (IDs on the per-calorie calculator)fdc.nal.usda.gov
- US Bureau of Labor Statistics, CPI Average Price Data, US city average, October 2026, series APU0000714233, APU0000708111, APU0000709112, APU0000FF1101 and APU0000710212bls.gov
- FAO, Dietary protein quality evaluation in human nutrition, FAO Food and Nutrition Paper 92, 2013fao.org
- Herreman, Nommensen, Pennings and Laus, Comprehensive overview of the quality of plant- and animal-sourced proteins based on the digestible indispensable amino acid score, Food Science and Nutrition, 2020pmc.ncbi.nlm.nih.gov
- USDA Agricultural Research Service, What We Eat in America, NHANES August 2021 to August 2023, data tablesars.usda.gov