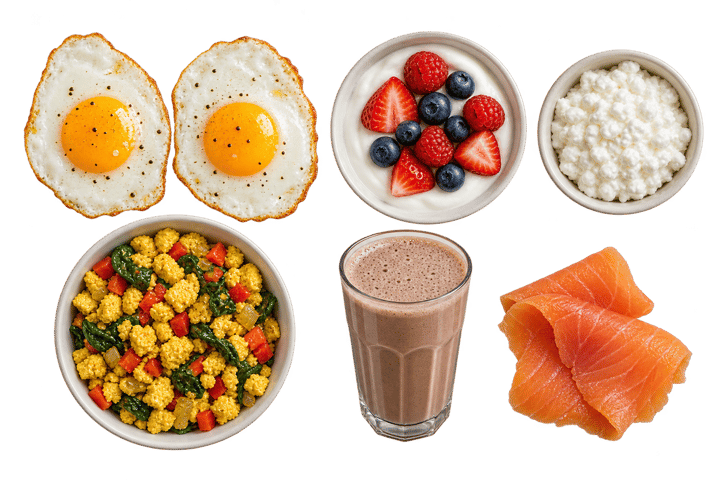
Which foods have the most protein per calorie?
Shrimp, canned tuna, turkey breast, cod and egg whites lead. Peanut butter sits under a plain bagel.
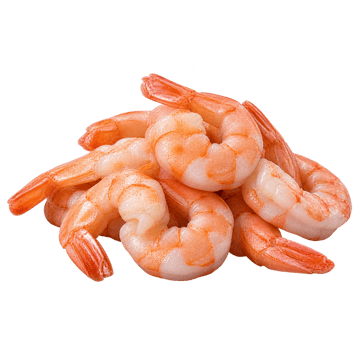
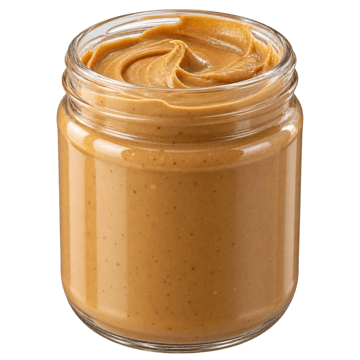
Which has more protein per calorie?
| # | Food | Protein | Calories | g per 100 cal | g per 100 calories | Amino score | FDC ID |
|---|---|---|---|---|---|---|---|
| 1 |  Shrimp, cooked3 oz | 20.4 g | 84 | 24.2 | 100 | 175180 | |
| 2 |  Whey isolate, unflavored1 scoop, branded | 25 g | 110 | 22.7 | 100 | 2339095 | |
| 3 |  Tuna, light, canned in water3 oz drained | 16.5 g | 73 | 22.6 | 100 | 173709 | |
| 4 | Whey protein powder1 scoop | 25 g | 113 | 22.2 | 100 | 173180 | |
| 5 |  Turkey breast, roasted3 oz | 25.1 g | 116 | 21.7 | 174516 | ||
| 6 |  Cod, cooked3 oz | 19.4 g | 89 | 21.7 | 100 | 171956 | |
| 7 |  Egg white1 large white | 3.6 g | 17 | 21.0 | 100 | 172183 | |
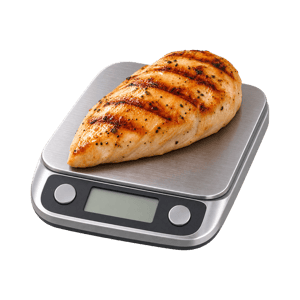
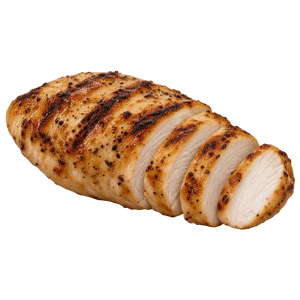
| 8 |  Chicken breast, grilled3 oz cooked | 25.9 g | 128 | 20.2 | 100 | 171534 | |
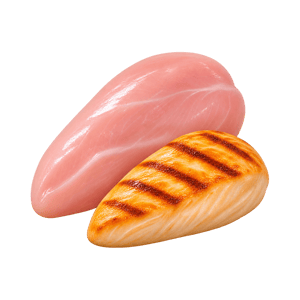
| 9 | Chicken breast, raw4 oz raw | 25.4 g | 136 | 18.8 | 100 | 171077 | |
| 10 | Chicken breast, roasted3 oz | 26.4 g | 140 | 18.8 | 100 | 171477 | |
| 11 | Pork tenderloin, roasted3 oz | 22.3 g | 122 | 18.3 | 100 | 168250 | |
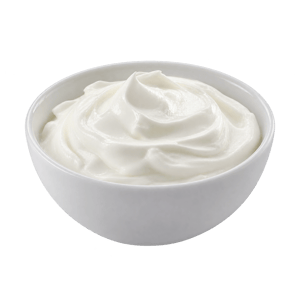
| 12 |  Greek yogurt, plain nonfat5.3 oz cup | 15.3 g | 88 | 17.3 | 100 | 170894 | |
| 13 |  Cottage cheese, 1%1/2 cup | 14 g | 81 | 17.2 | 100 | 173417 | |
| 14 | Seitan strips2 oz, branded | 15 g | 90 | 16.7 | 2495506 | ||
| 15 |  Top sirloin, lean, broiled3 oz | 25 g | 151 | 16.5 | 100 | 174054 | |
| 16 | Chicken thigh, raw4 oz raw | 22.3 g | 137 | 16.3 | 173627 | ||
| 17 | Chicken thigh, roasted3 oz | 21.1 g | 152 | 13.9 | 172388 | ||
| 18 |  Ground beef 93/7, browned3 oz | 24.6 g | 178 | 13.8 | 174755 | ||
| 19 | Ground beef 93/7, raw4 oz raw | 23.5 g | 172 | 13.7 | 173110 | ||
| 20 | Skyr, plain lowfat3/4 cup, branded | 18 g | 139 | 12.9 | 2384986 | ||
| 21 | Cottage cheese, 2%1/2 cup | 11.8 g | 92 | 12.8 | 172182 | ||
| 22 |  Tofu, firm1/2 cup | 21.8 g | 181 | 12.0 | 100 | 172475 | |
| 23 |  Sardines, canned in oil1 can drained | 22.6 g | 191 | 11.8 | 100 | 175139 | |
| 24 | Tofu, firm, with nigari1/2 cup | 11.4 g | 98 | 11.6 | 100 | 172448 | |
| 25 |  Salmon, farmed, cooked3 oz | 18.8 g | 175 | 10.7 | 100 | 175168 | |
| 26 |  Tempeh3 oz | 17.3 g | 163 | 10.6 | 100 | 174272 | |
| 27 |  Edamame, shelled1 cup | 18.4 g | 188 | 9.8 | 100 | 168411 | |
| 28 | Greek yogurt, plain whole milk5.3 oz cup | 13.5 g | 146 | 9.3 | 171304 | ||
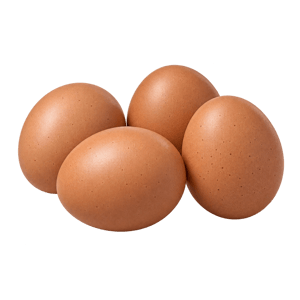
| 29 | Egg, whole, large1 large egg | 6.3 g | 72 | 8.8 | 100 | 171287 | |
| 30 | Beef jerky1 oz | 9.4 g | 116 | 8.1 | 167536 | ||
| 31 | String cheese (part-skim mozzarella)1 oz stick | 6.7 g | 84 | 8.1 | 171244 | ||
| 32 |  Lentils, boiled1 cup | 17.9 g | 230 | 7.8 | 98methionine and cysteine | 172421 | |
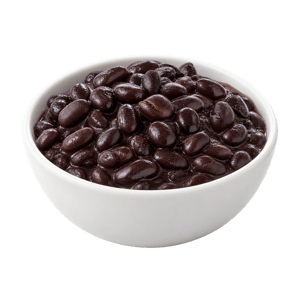
| 33 |  Black beans, boiled1 cup | 15.2 g | 227 | 6.7 | 100 | 173735 | |
| 34 |  Milk, 2%1 cup | 8.1 g | 122 | 6.6 | 100 | 171267 | |
| 35 | Yogurt, plain whole milk6 oz | 5.9 g | 104 | 5.7 | 171284 | ||
| 36 |  Cheddar1 oz | 6.5 g | 114 | 5.7 | 173414 | ||
| 37 |  Chickpeas, boiled1 cup | 14.5 g | 269 | 5.4 | 100 | 173757 | |
| 38 |  Pumpkin seeds1 oz | 8.6 g | 158 | 5.4 | 91lysine | 170556 | |
| 39 | Egg yolk1 large yolk | 2.7 g | 55 | 4.9 | 172184 | ||
| 40 |  Whole wheat bread1 slice | 4 g | 81 | 4.9 | 60lysine | 172688 | |
| 41 |  Bagel, plain1 medium | 11.1 g | 277 | 4.0 | 174899 | ||
| 42 |  Peanut butter2 tbsp | 7.1 g | 191 | 3.7 | 68lysine | 174266 | |
| 43 |  Almonds1 oz | 6 g | 164 | 3.7 | 60lysine | 170567 | |
| 44 |  Quinoa, cooked1 cup | 8.1 g | 222 | 3.7 | 100 | 168917 | |
| 45 |  Spaghetti, cooked1 cup | 7.2 g | 196 | 3.7 | 50lysine | 169737 | |
| 46 |  Oats, dry1/2 cup | 5.3 g | 153 | 3.5 | 100 | 173904 | |
| 47 | Hummus2 tbsp | 2.3 g | 71 | 3.3 | 100 | 174289 | |
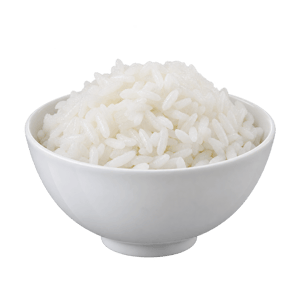
| 48 |  White rice, cooked1 cup | 4.3 g | 205 | 2.1 | 80lysine | 168878 | |
| 49 |  Banana1 medium | 1.3 g | 105 | 1.2 | 173944 |
Two USDA records disagree for canned light tuna (19.4 or 25.5 g per 100 g), and the table uses 173709. Firm tofu has two records too (17.3 and 9.04 g), and both are shown. Per calorie each pair comes out about the same, about 22 for tuna and 12 for tofu, so labels vary by brand. In USDA's data, 2% cottage cheese has less protein than 1%. Rows marked raw are weighed raw. The amino score is the food's scarcest essential amino acid as a share of the adult pattern (FAO 2013), capped at 100, from USDA's amino acid rows. Blank where USDA has no usable row, and soy foods share the cooked soybean record (how it's worked out).
What your result means and what to do next
- Pick three or four foods from the top that you like. Keep them in the kitchen and put one in each meal.
- If calories are tight, on a diet, on a GLP-1 or on 1,200 calories, stay with foods above about 15 g per 100 calories.
- If they aren't, look at the serving column instead. Sardines, firm tofu and lean steak carry as much per serving as chicken, with more calories.
Then put them into a meal in the meal line calculator. Eating mostly plants? The best plant-based protein sources, ranked has the plant list on its own.
Why per calorie
A protein day has to fit in your calories. 100 g of protein is 400 calories, so on a 1,600 calorie day it's a quarter of everything you eat. Foods with 15 g or more per 100 calories make that easy, and foods under 5 make it hard, however much protein the label shouts about.
It works like miles per gallon. A big tank tells you little until you know how far each gallon goes.
The surprises
- Shrimp (24.2 g per 100 calories), canned light tuna (22.6), cod and turkey breast (21.7) and egg whites (21.0) beat grilled chicken breast (20.2).
- Peanut butter and almonds have 3.7, less than a plain bagel (4.0) or a slice of whole wheat bread (4.9). They're good food, but not protein foods.
- 1% cottage cheese (17.2) matches nonfat Greek yogurt (17.3). 2% cottage cheese is 12.8.
- Farmed salmon (10.7) has about half the protein per calorie of cod (21.7).
- A large egg's yolk carries 43% of its protein, 2.7 of 6.3 g.
How the table works
Each row is one USDA FoodData Central record, SR Legacy unless marked branded, with its FDC ID linked. Grams per 100 calories is the protein in 100 g divided by the calories in 100 g, times 100. Servings are US servings, and cooked meat is weighed cooked unless the row says raw.
2 sources
- USDA Agricultural Research Service. FoodData Central, SR Legacy and branded records, each row by its FDC IDfdc.nal.usda.gov
- USDA National Agricultural Library, Food and Nutrition Information Center: calories per gram of protein, carbohydrate and fatnal.usda.gov